The home page
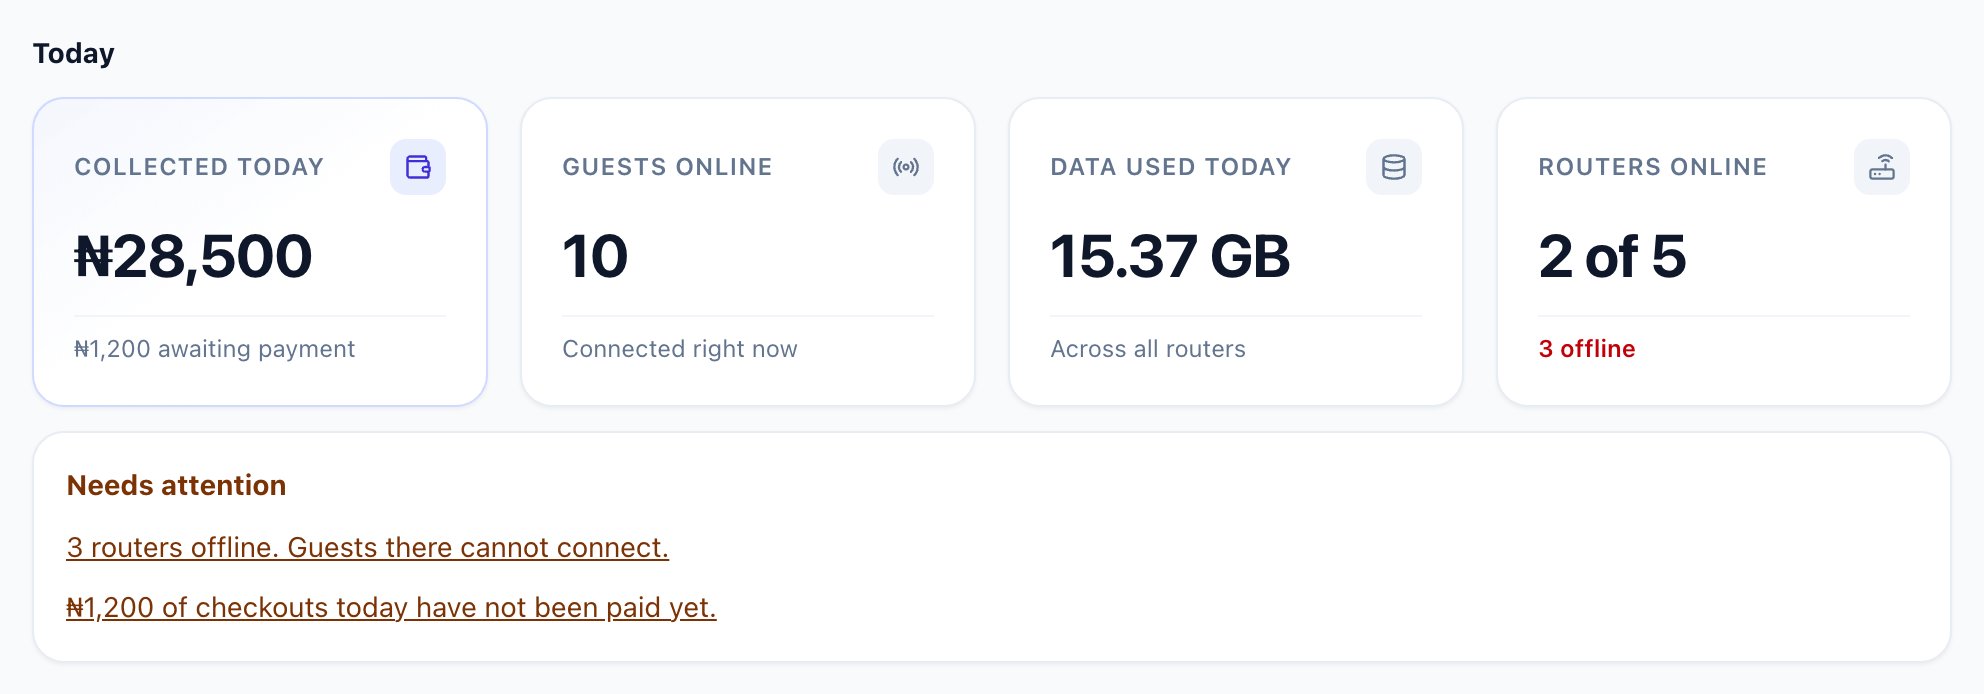
Today sits at the top, in four cards:
Under the cards, Needs attention lists anything you should act on: routers that are offline, and checkouts from today that have not been paid. Each line links to the page where you fix it. When nothing needs you, it says so in one line.
Top users today
Top users today lists the devices that used the most data since midnight, with how much each used and what share of the day’s total that is. The line at the top says it plainly, for example these 10 devices used 62% of today’s 48 GB. Each row shows the customer and their plan. A device that never signed in shows as Unregistered guest, with the end of its device address so you can recognise it. Select a customer to open their page, or All devices to see every device sorted by data used today. Use it when the WiFi feels slow: one device using a large share of the day is usually the reason. You can then decide whether to speak to that customer or put a fair-use limit on the plan.What “revenue” means
This matters when you compare the dashboard against your Paystack, Flutterwave, Squad, or PalmPay dashboard. If your provider shows more transactions than WifiPadi shows revenue, the difference is failed and abandoned attempts. See Payments and revenue to view those attempts. Wallet balance is counted once, not twice. If a customer tops up ₦2,000 and later spends ₦500 of it on a plan, your revenue goes up by ₦2,000 — not ₦2,500. The ₦500 was already your money from the moment they topped up. Counting it again would show you more money than your bank has.The location page
Select any location under Locations to open it. Pick a period at the top right: 7 days, 30 days, or 90 days. Every number on the page follows that period. The four cards at the top are Cash collected, Customers, Data used, and Live now. Under Cash collected you also see your all-time total, and — if any payments failed or are still pending — a link to review them. Below the cards:- Revenue per day — cash collected each day at this location.
- What sells here — which plans your customers actually buy. This card counts every plan taken up, including plans paid for from a wallet balance, so it can be higher than Cash collected. When that happens, a note at the bottom tells you exactly how much was wallet-funded.
- Top customers — ranked by cash spent at this location, with the data each one used.
- Busiest hours — when sessions start, by hour of day. Use this to plan support or staffing.
- Gateways at this location and a recent payments feed.
- Payment methods here — which of your payment providers guests at this location can pay with. Leave it on All connected gateways, or choose Only the ones I pick to limit this location. For example, take Squad at one venue and Paystack at another.
A free plan shows in What sells here as redemptions rather than sales, because no money changed hands.
Usage analytics
Go to Usage Analytics for data rather than money. Totals for Total bandwidth, Download traffic and Upload traffic sit above four sections:
Use this page to decide whether your plan data limits are set correctly. If most customers never reach their limit, you may be able to sell a smaller, cheaper plan. If everyone hits the cap, a larger plan may sell.